
2.1.2023 XAU/USD Technical analysis (Daily timeframe)
Chart XAU/USD
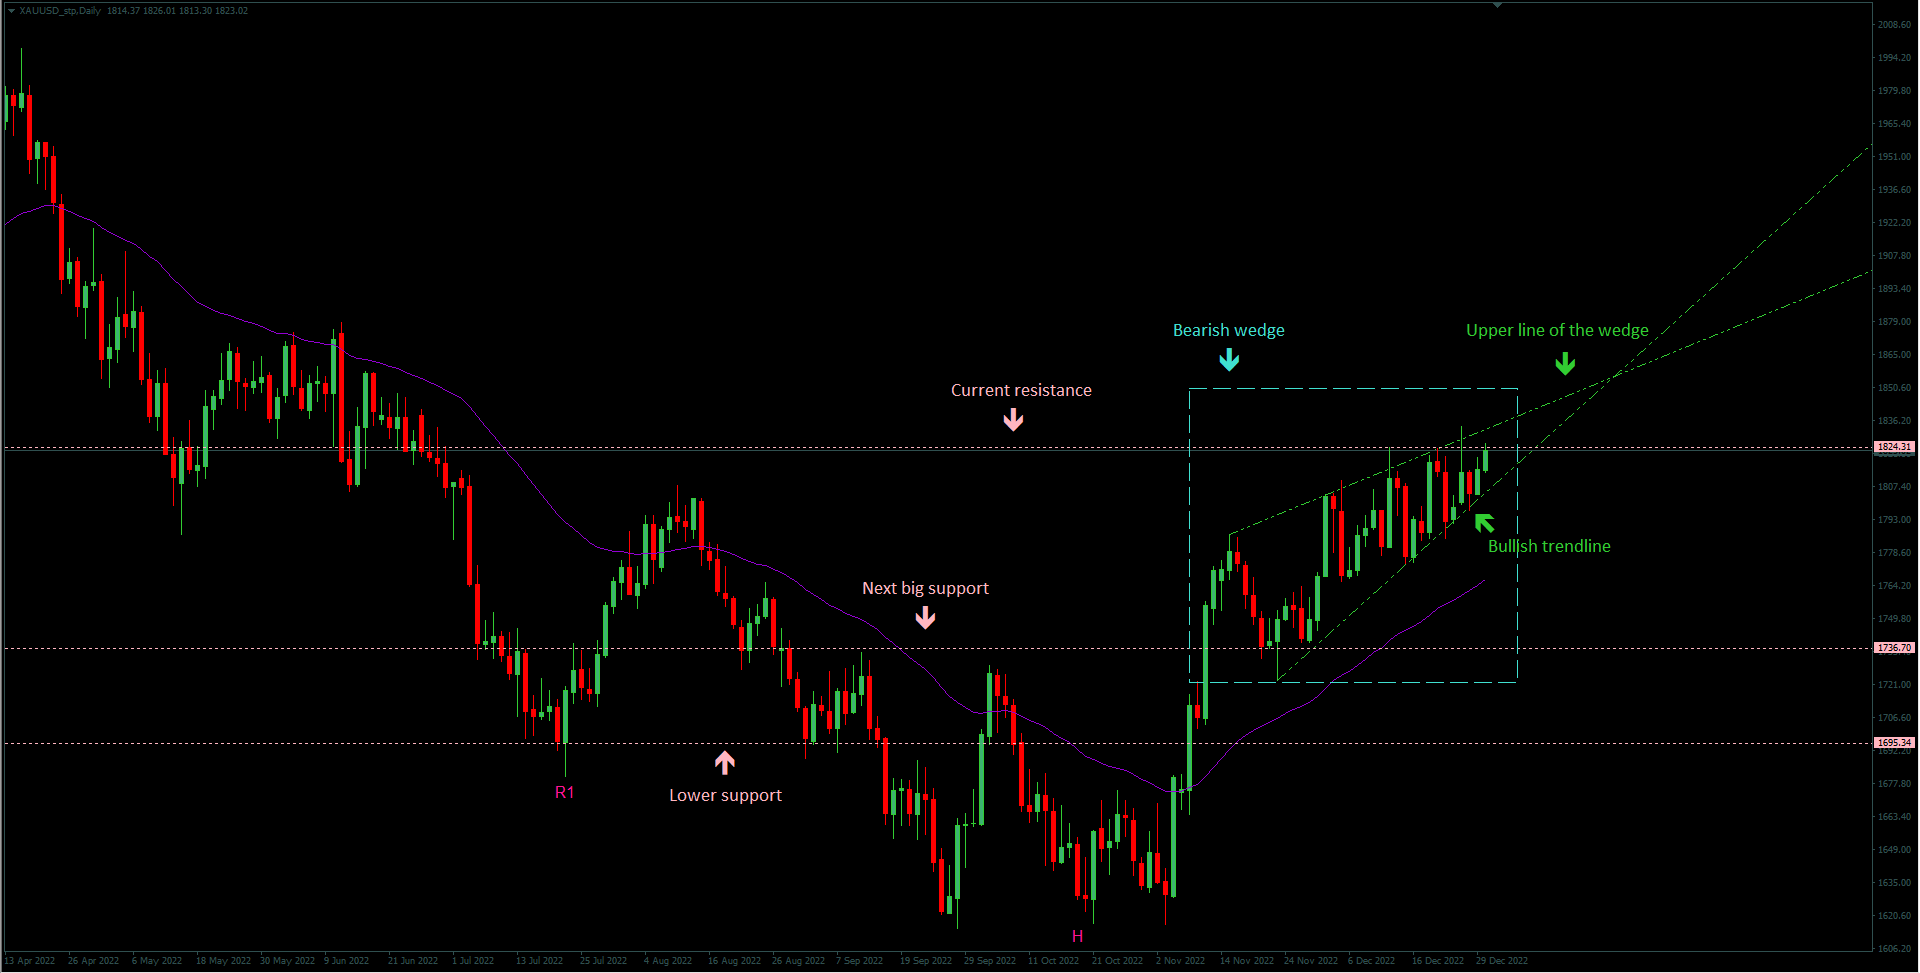
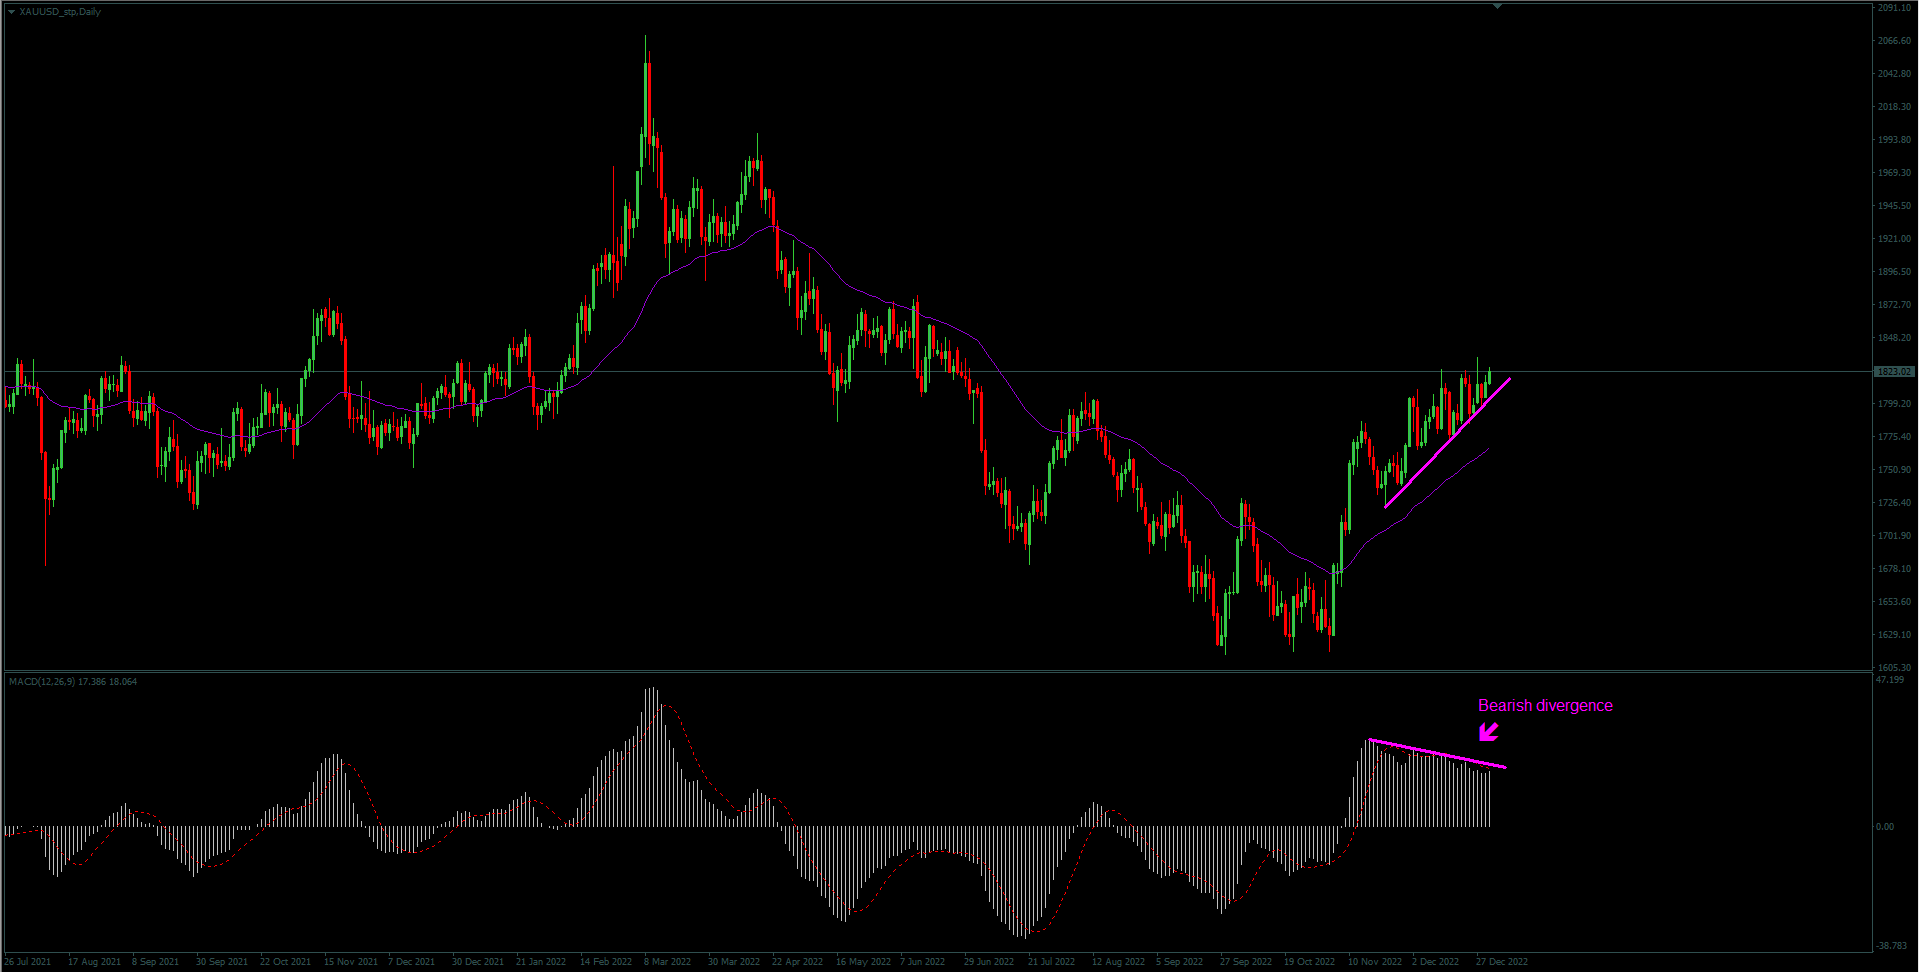
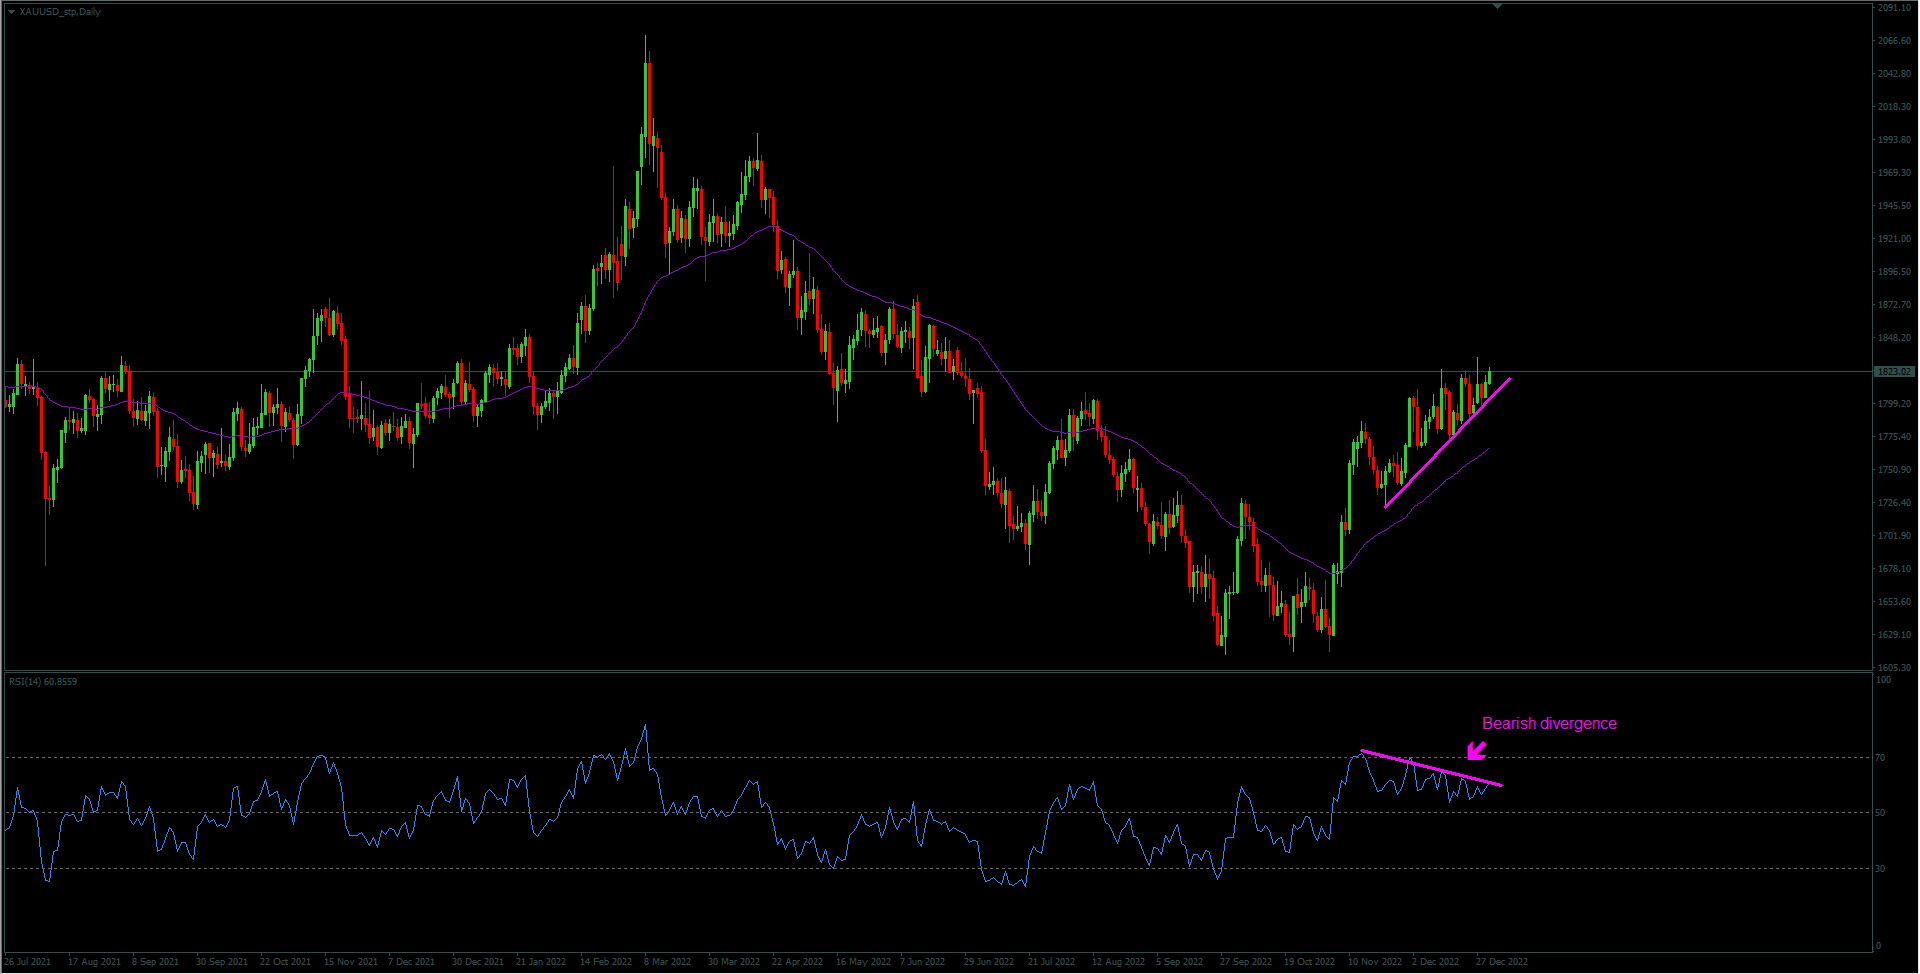
XAU/USD is still trying to reach higher prices, but it doesn’t have much strenght left! Price is still locked in the bearish wedge, which could signal pullback or reversal. I’m definitely short bias, because gold isn’t that type of market that goes only up! As you can see down below, there is bearish divergence on every one of listed indicators, which can’t go forever. When trading divergence, you have to wait for the break of the current trendline and that’s exactly what I’m waiting for! The best time to entry a short position will be on the pullback after the break of the trendline.
And what about a price target? We have plenty room for pullback, so I would set my long price target to the marked "Next big support". For mid-term trading set the target around EMA 45. I believe that the bottom was found, so be quick when the pullback stops.
MACD XAU/USD
RSI XAU/USD
Volume XAU/USD

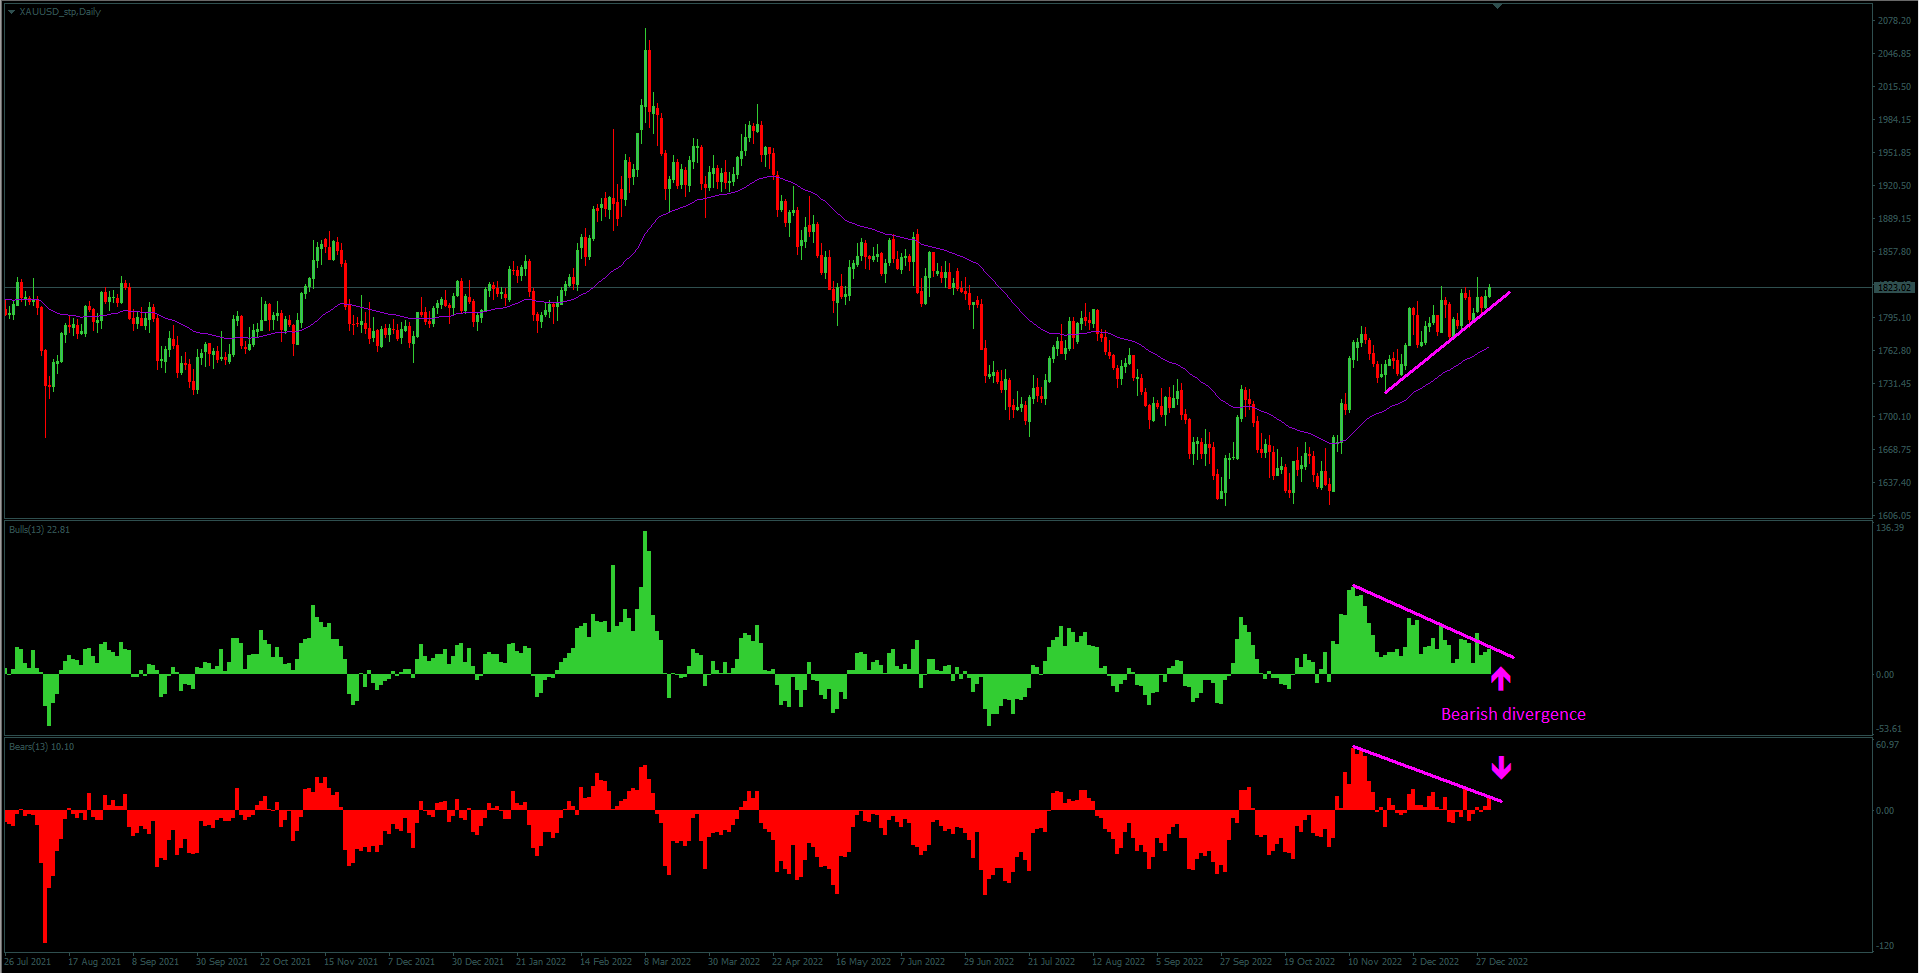
Volume shows that the probability of a pullback is even higher. Of course that volume is lower partially because of recent holiday period, so we shouldn’t pay to much attention to volume bearish divergence. But what we should look for is tomorrov’s volume and price move! If there will be an increase in volume and the price will move down, we can expect a break of the trendline, otherwise we could expect an even higher price! Be patient!
Bulls and Bears XAU/USD
4-hour chart EUR/USD
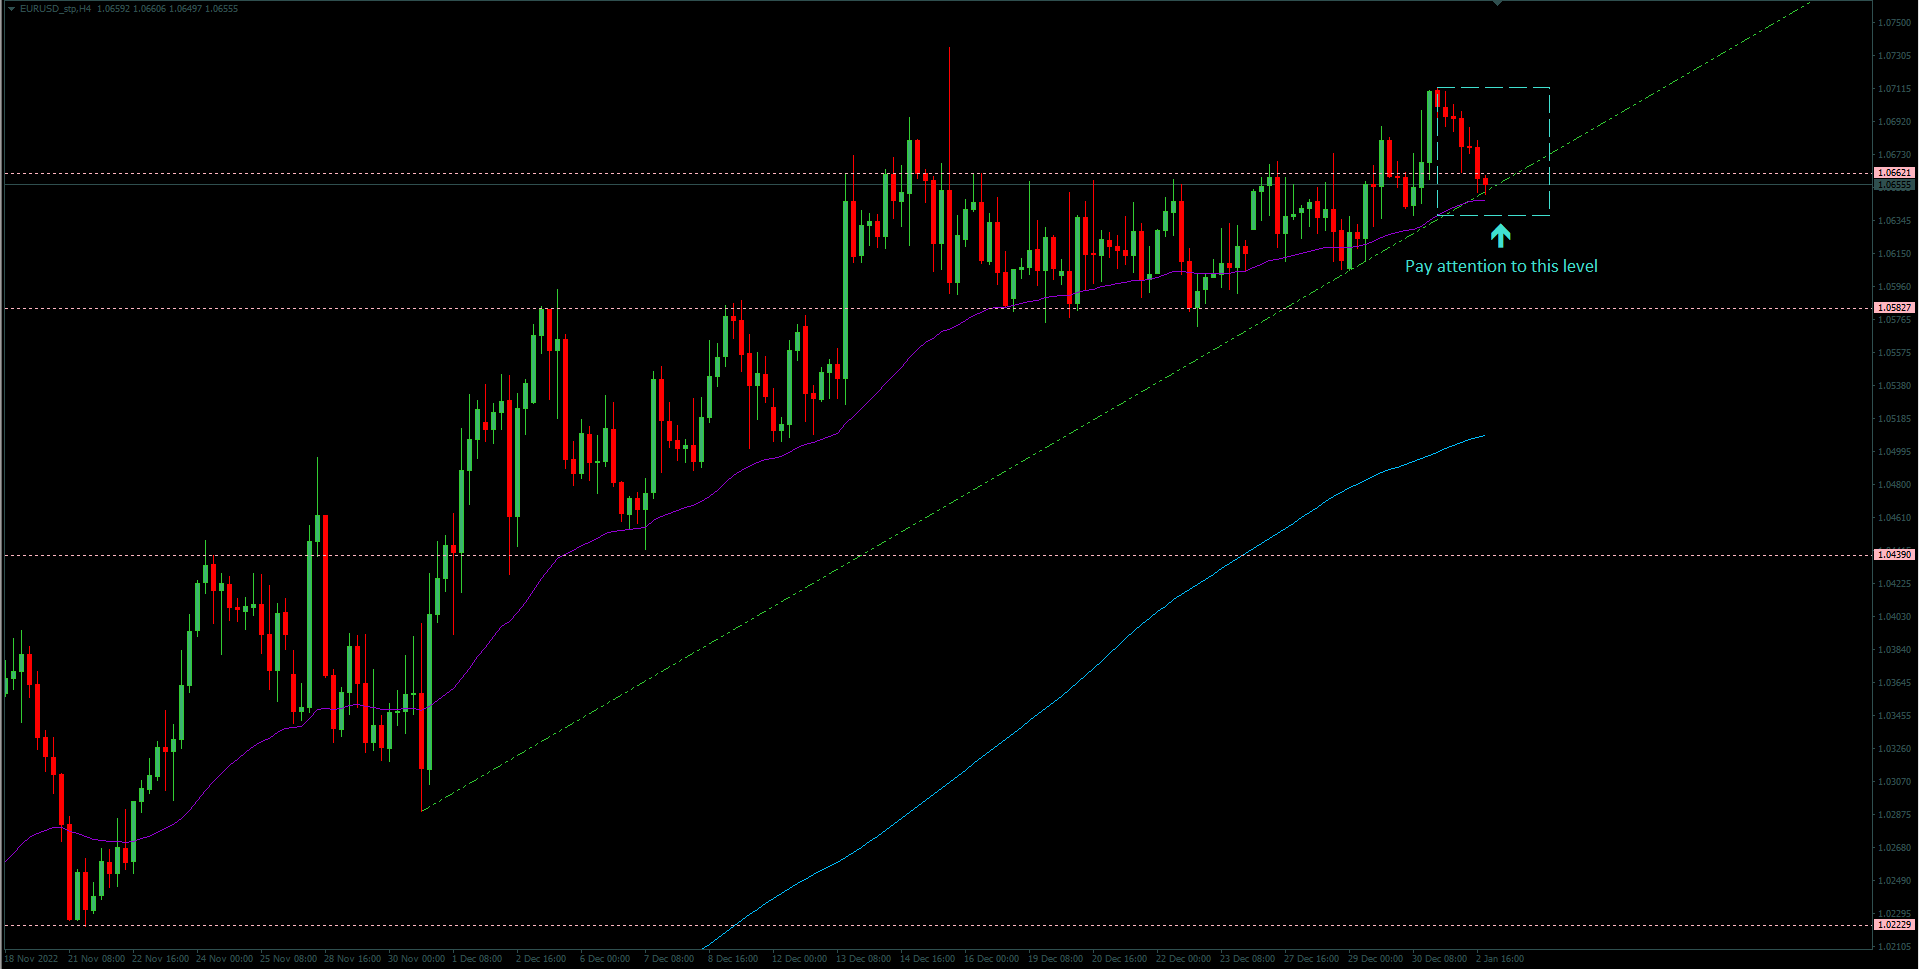
Last thing to this analysis is the EUR/USD. Because there’s a big positive correlation between Gold and EUR/USD, we have to follow it’s price also. For short we want a break of EMA 45 on 4-hour EUR/USD, for long we look for a bounce of the marked bullish trendline.
Wish you great profits!
written by Filip Lemon