
10.12.2022 SP500 Technical analysis (Daily time frame)
10.12.2022
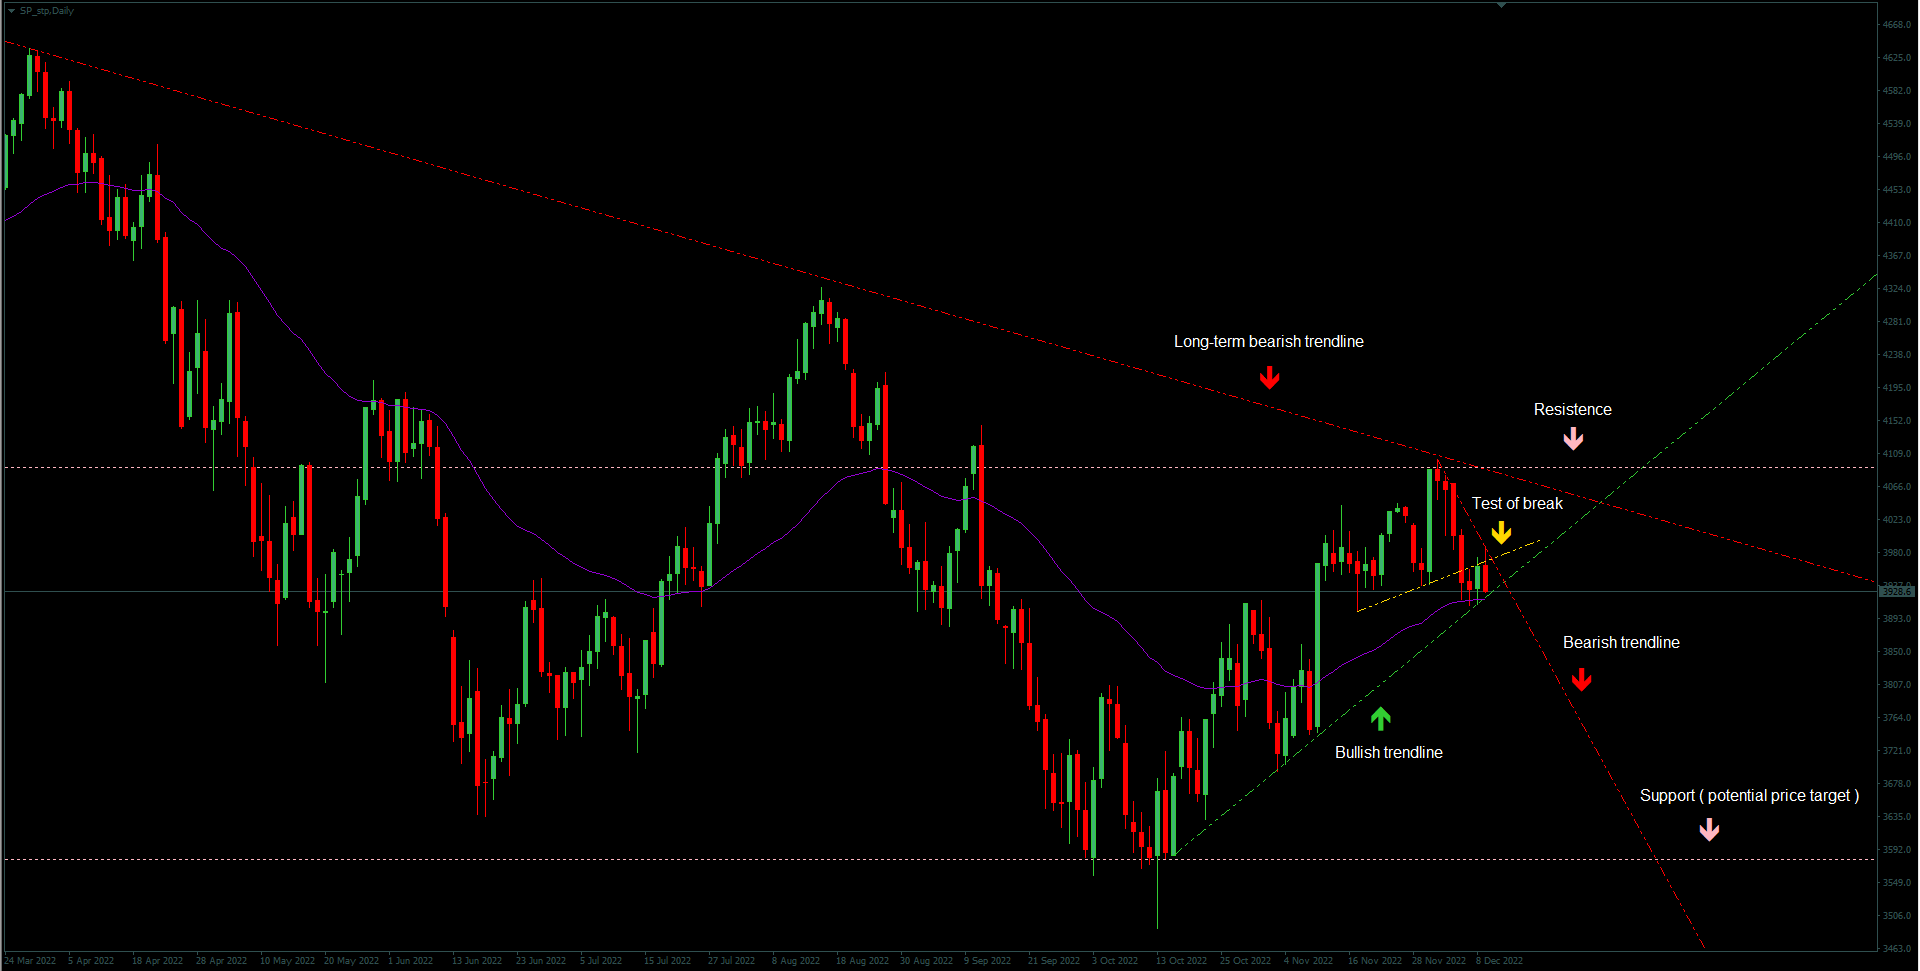
Chart SP500
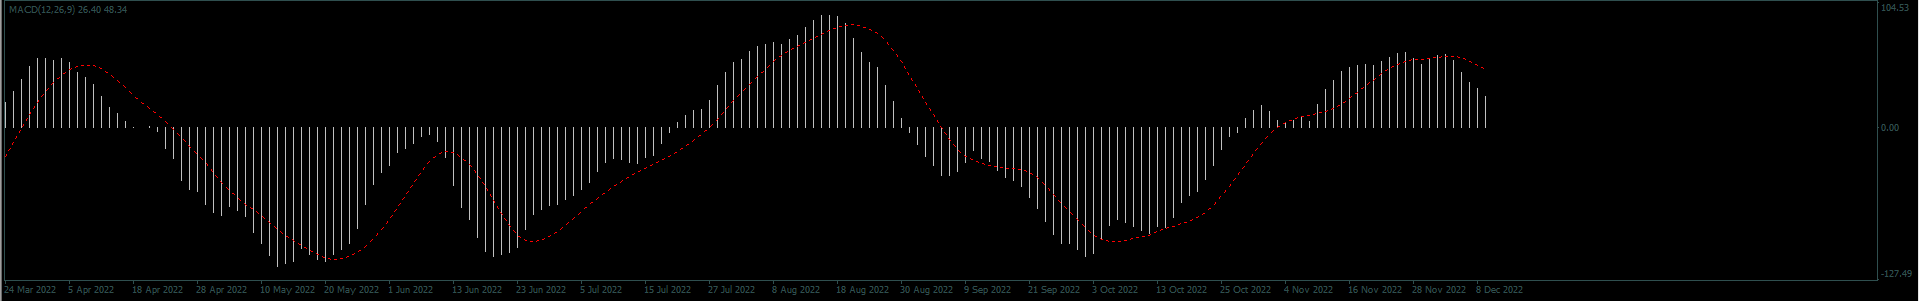
MACD SP500
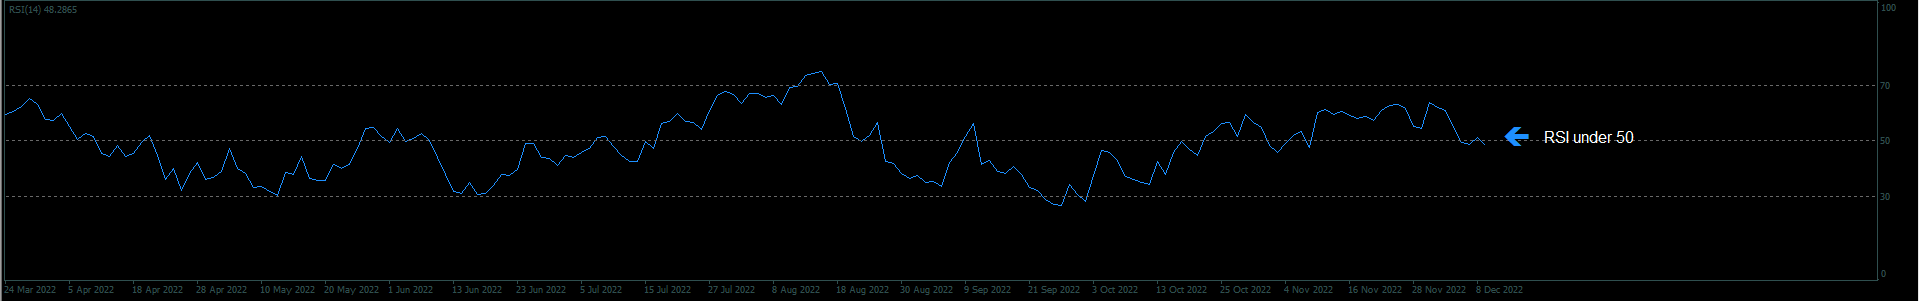
RSI SP500
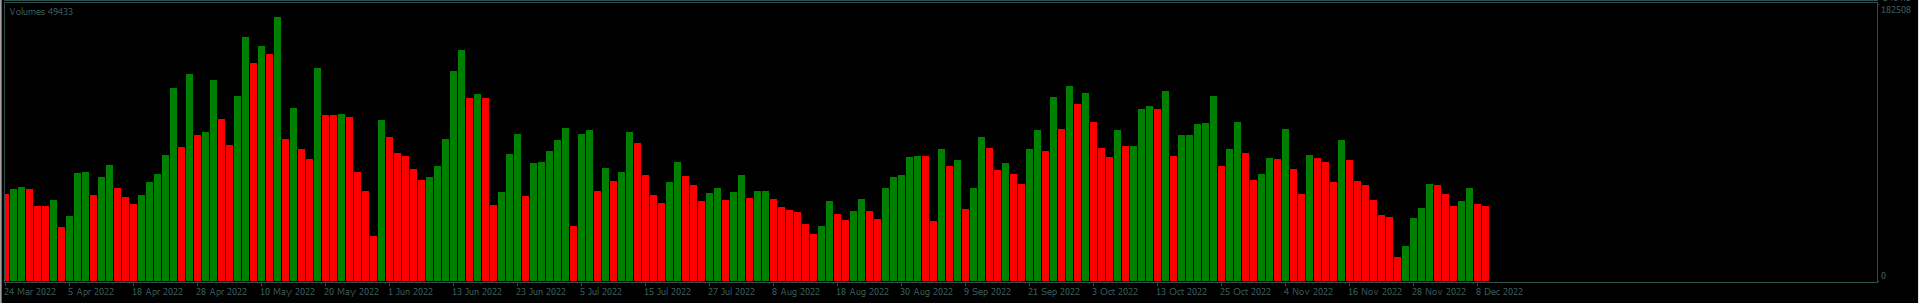
Volumes SP500
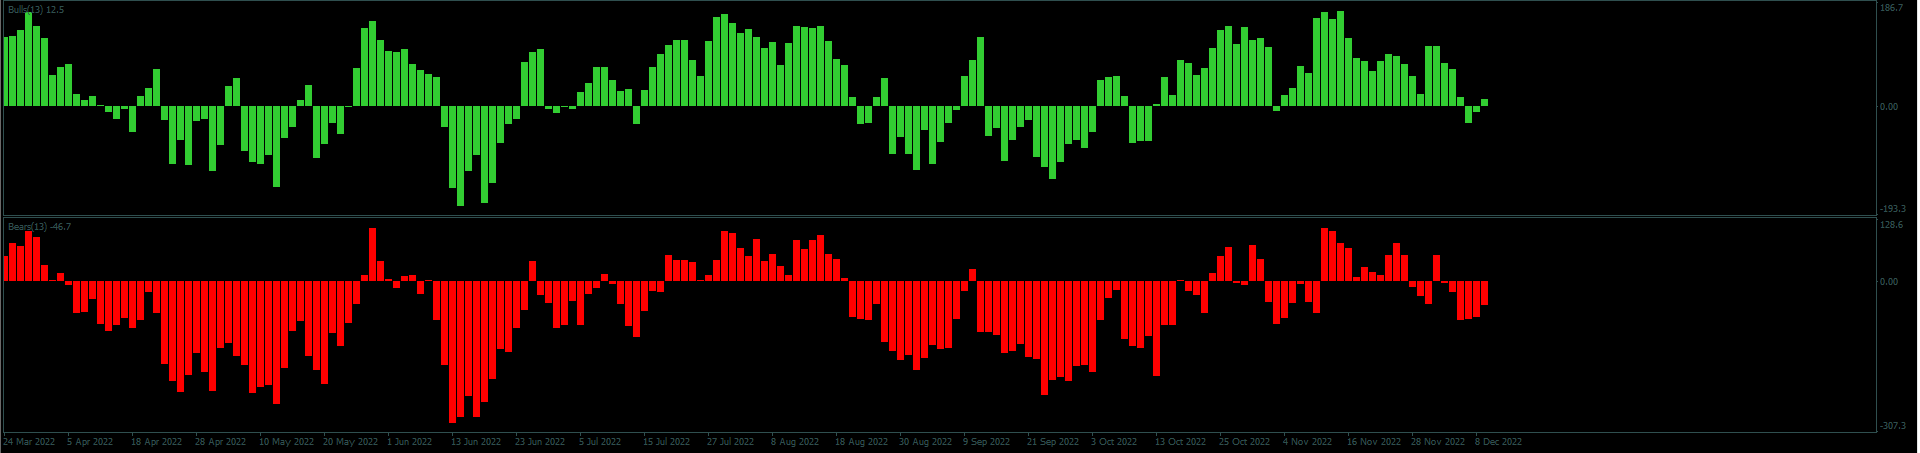
Bulls and Bears SP500
Next week on SP500 is promising great opportunities for selling the market. Price tested the long-term bearish trendline and failed to move higher. Price action looks pretty good to, as you can see on a chart that yellow support was breaked and tested successfully. RSI indicator is below 50 points which is also a short signal. Plan your next moves on SP500 and make profits.
written by Filip Lemon